AWS Monitoring Tools: An Introduction
By 2026, AWS monitoring isn’t just about checking uptime or watching CPU graphs. It has grown into something far more powerful: AI-driven observability built for scale, speed, and complexity.
Today’s AWS cloud monitoring tools use automation and intelligence to spot anomalies early, connect metrics with logs and traces, and surface root causes in real time. The shift is clear- from reactive monitoring to proactive, insight-led observability. And it’s happening because modern cloud environments demand it.
Think microservices, containers, serverless workloads, and multi-region architectures. In setups like these, static dashboards and noisy alerts simply don’t cut it. Teams need monitoring that sees the full picture, cuts through alert fatigue, speeds up incident response, and keeps performance and costs in check.
That’s why choosing the right AWS infrastructure monitoring tools matters more than ever.
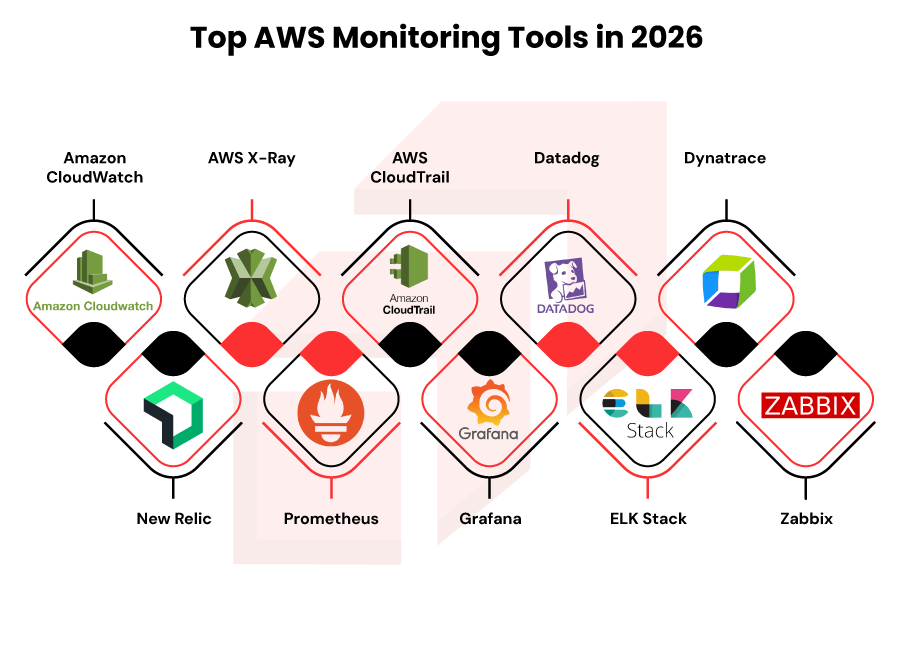
In this guide, we break down the top 10 AWS monitoring tools in 2026 – covering native services from AWS, enterprise and multi-cloud platforms, open-source and free options as well as we also share our own insight of this tools – so you can match the tool to your architecture and growth stage.
At its core, cloud monitoring tools answers four simple but critical questions:
- Is my system up?
- Is it slow?
- Is it about to fail?
- Is it costing more than it should?
Modern AWS monitoring goes further. It connects metrics, logs, traces, and events into clear, actionable insights – helping teams move faster, operate smarter, and stay ahead of problems before users ever notice.
If your cloud is growing, your monitoring needs to grow up with it.
What are AWS Monitoring Tools?
AWS monitoring tools are designed to answer one simple but critical question: “What’s really happening inside my cloud right now?” They continuously track how your applications, infrastructure, and services are behaving spotting slowdowns, failures, security gaps, or unusual usage before they turn into business problems.
If you’re looking for a list of AWS monitoring tools, the essentials include Amazon CloudWatch for metrics and logs, AWS X-Ray for application tracing, AWS CloudTrail for API activity tracking, and AWS Config for compliance monitoring.
Many teams also start with a free cloud monitoring tool for AWS, as CloudWatch basic metrics and CloudTrail event history are available at no cost – making it easy to monitor first, scale later.
Expert Insight from Rapyder:
“For us, AWS monitoring isn’t just about dashboards – it’s about trust. We use AWS monitoring tools to spot issues early, act faster, optimize costs, and keep systems secure and compliant-especially in BFSI. That’s how we turn cloud complexity into reliable outcomes.” – Cloud Monotoring Team at Rapyder.
AWS Monitoring vs. AWS Observability (Not the Same Thing)
This confusion costs teams months.
Monitoring |
Observability |
| Tells you something broke | Tells you why it broke |
| Predefined metrics & alerts | Correlated metrics + logs + traces |
| Reactive | Proactive |
| “CPU is high” | “API latency increased due to DB lock” |
Most teams start with AWS monitoring tools and evolve into observability once scale and complexity demand it.
How to Choose the Best AWS Infrastructure Monitoring Tool
Before jumping into tools, ask yourself:
- Are you AWS-only or multi-cloud?
- Do you need infra-only or app-level visibility?
- Is cost optimization critical?
- Do you want native simplicity or enterprise depth?
A good rule:
- Small teams → Native & open-source
- Growing SaaS → Hybrid
- Enterprise / BFSI → Enterprise-grade observability.
Top AWS Monitoring Tools in 2026 – Detailed Breakdown
Section A – Native AWS server Monitoring Tools
- Amazon CloudWatch
Overview
Amazon CloudWatch is the native foundation of AWS monitoring – collecting metrics, logs, and events across almost every AWS service.
Best for (Use-Case Fitment)
- Core AWS infrastructure monitoring
- Teams starting their AWS monitoring journey
- Cost-conscious setups
Key AWS Integrations
EC2, RDS, Lambda, EKS, ECS, S3, ELB, API Gateway
Pros & Limitations
Pros
- Deep native integration
- No third-party dependency
- Flexible alarms and dashboards
Limitations
- Limited root-cause analysis
- Manual correlation across metrics, logs, and traces
Rapyder’s POV
CloudWatch works best when architected intentionally. Most customers over-collect data and under-use insights. Rapyder optimizes CloudWatch for signal clarity, cost control, and compliance-readiness.
- AWS X-Ray
Overview
AWS X-Ray provides distributed tracing to visualize service dependencies and application latency.
Best for
- Microservices and serverless workloads
- Debugging performance constraints
- API-heavy architectures
Key AWS Integrations
Lambda, EC2, ECS, EKS, API Gateway, Elastic Beanstalk
Pros & Limitations
Pros
- Native tracing with minimal setup
- Visual service maps
- Low overhead
Limitations
- AWS-only
- Not a full observability platform
Rapyder’s POV
X-Ray is powerful but underused. We integrate it with CloudWatch and logs to turn tracing into real root-cause intelligence, not just diagrams.
- AWS CloudTrail
Overview
CloudTrail tracks every API action across your AWS environment – critical for security and governance.
Best for
- Compliance-driven industries (BFSI, HealthTech)
- Security monitoring
- Audit trails
Key AWS Integrations
IAM, S3, CloudWatch, AWS Config, Security Hub
Pros & Limitations
Pros
- Mandatory for governance
- Immutable audit history
- Native AWS security alignment
Limitations
- Not performance-focused
- Requires analysis tooling for insights
Rapyder’s POV
CloudTrail isn’t optional – it’s strategic. Rapyder ensures CloudTrail data is actionable, searchable, and audit-ready, not just archived.
Section B – Enterprise / Multi-Cloud Tools
- Datadog
Overview
Datadog is a full-stack observability platform with strong AIOps capabilities.
Best for
- High-growth SaaS
- Complex AWS + Kubernetes environments
- Teams needing rapid RCA
Key AWS Integrations
EC2, EKS, RDS, Lambda, CloudWatch, S3, ELB
Pros & Limitations
Pros
- Unified metrics, logs, traces
- AI-driven alerts
- Excellent dashboards
Limitations
- Expensive at scale
- Requires governance to avoid uncontrolled growth
Rapyder’s POV
Datadog delivers value fast – but only with discipline. We help customers control costs, tune alerts, and align observability with business SLAs.
- Dynatrace
Overview
Dynatrace is an enterprise-grade observability platform built for scale and regulation-heavy environments.
Best for
- BFSI and large enterprises
- Mission-critical applications
- AI-powered root cause analysis
Key AWS Integrations
EC2, EKS, RDS, ELB, VPC Flow Logs
Pros & Limitations
Pros
- Automatic dependency mapping
- Strong AIOps engine
- Enterprise governance
Limitations
- High licensing cost
- Steeper learning curve
Rapyder’s POV
Dynatrace shines in regulated setups. Rapyder ensures faster onboarding and cleaner observability models, especially for BFSI workloads.
- New Relic
Overview
New Relic offers a unified telemetry platform with a developer-friendly approach.
Best for
- Product engineering teams
- Hybrid monitoring needs
- Cost-sensitive observability
Key AWS Integrations
EC2, Lambda, EKS, RDS, CloudWatch
Pros & Limitations
Pros
- Generous free tier
- Flexible pricing
- Strong developer adoption
Limitations
- UI complexity at scale
- Requires tuning for enterprise use
Rapyder’s POV
New Relic is powerful but noisy out of the box. We streamline dashboards and alerts so teams focus on what matters not everything.
Section C – Best Open-Source/Free Cloud Monitoring Tools for AWS
- Prometheus
Overview
Prometheus is the backbone of cloud-native and Kubernetes monitoring.
Best for
- EKS-based architectures
- Cloud-native teams
- Open-source-first organizations
Key AWS Integrations
EKS, EC2, ALB, custom exporters
Pros & Limitations
Pros
- Open source
- Highly flexible
- Strong Kubernetes ecosystem
Limitations
- Requires operational expertise
- No native long-term storage
Rapyder’s POV
Prometheus is powerful but operationally heavy. Rapyder helps enterprises productionize Prometheus without turning it into a maintenance burden.
- Grafana
Overview
Grafana turns metrics into clear, visual stories across AWS environments.
Best for
- Dashboarding across tools
- Unified visibility
- NOC and SRE teams
Key AWS Integrations
CloudWatch, Prometheus, Loki, OpenTelemetry
Pros & Limitations
Pros
- Best-in-class visualization
- Open ecosystem
- Cloud and self-hosted options
Limitations
- Visualization-only
- Needs backend data sources
Rapyder’s POV
Grafana’s value lies in curation. We design dashboards that executives and engineers both understand.
- ELK Stack
Overview
ELK Stack provides log-centric monitoring and analytics at scale.
Best for
- Log-heavy workloads
- Security and audit analysis
- Custom log analytics
Key AWS Integrations
EC2, CloudWatch Logs, VPC Flow Logs, S3
Pros & Limitations
Pros
- Powerful search and analytics
- Open-source flexibility
- No vendor lock-in
Limitations
- Resource-intensive
- Requires tuning and scaling expertise
Rapyder’s POV
ELK delivers insights when optimized. We help teams control cost, performance, and retention – critical at scale.
- Zabbix
Overview
Zabbix is a mature open-source infrastructure monitoring tool.
Best for
- Budget-conscious enterprises
- Traditional workloads
- On-prem + AWS hybrid setups
Key AWS Integrations
EC2, RDS (via agents), custom metrics
Pros & Limitations
Pros
- Zero licensing cost
- Strong alerting
- Mature ecosystem
Limitations
- Less cloud-native
- UI and scaling limitations
Rapyder’s POV
Zabbix works when budgets are tight – but we recommend pairing it with AWS-native tools for modern cloud visibility.
How Rapyder Helps You Win with AWS Monitoring & Observability
Most AWS monitoring setups show data. Rapyder makes sure that data drives decisions, uptime, and savings.
We help organizations move from reactive alerts to AI-driven AWS monitoring and observability, designed around business impact – not just infrastructure metrics.
What We Do (In Short)
- Design right-fit AWS monitoring architectures using native, open-source, and enterprise tools
- Eliminate alert noise with intelligent, anomaly-driven alerts
- Build unified visibility across metrics, logs, and traces
- Optimize monitoring costs and data retention
- Ensure audit-ready, enterprise-grade governance, especially for BFSI workloads
Case Study: From Alert Fatigue to Actionable Observability
Industry: BFSI
Challenge:
A fast-growing financial services company was struggling with alert fatigue across EC2, RDS, and containerized workloads. Incidents were detected late, root-cause analysis was slow, and monitoring costs were climbing.
Rapyder’s Approach:
- Implemented AWS-native monitoring with CloudWatch and CloudTrail
- Added application-level tracing for faster root-cause identification
- Tuned alerts using anomaly detection to cut noise
- Optimized log ingestion and retention to control costs
Impact:
- 40% reduction in false alerts
- Faster incident detection and resolution
- Lower monitoring overhead without losing visibility
- Audit-ready monitoring aligned with compliance needs
The result: monitoring that supported growth instead of slowing it down.
Click here to explore more case studies.
Ready to Upgrade Your AWS Monitoring?
If your current AWS cloud monitoring tools still feel reactive, noisy, or expensive – it’s time to level up.
- Build AI-driven AWS monitoring and observability that scales with your business
- Cut costs by 30-50% through optimized alerting and resource efficiency.
Click here to explore how Rapyder can help:
Because in 2026, the question isn’t “Do you have monitoring?”
It’s “Does your monitoring help you act – fast?”
Conclusion
In 2026, monitoring isn’t optional – it’s operational survival.
The best AWS monitoring tools are the ones that:
- Match your scale
- Fit your budget
- Answer real operational questions
Start native. Go open-source if you need flexibility. Move enterprise when complexity demands it.
And remember – visibility without action is just data.
If your AWS monitoring tools aren’t driving better business decisions, it’s time to rethink the stack.