

By default monitoring, we will get only metrics Like CPUUtilization, StatusCheckFailed_System, and StatusCheckFailed_Instance, etc.
If we want to monitor Custom metrics (Memused, Logical disk usage, Autoscaling metrics, etc.), we must install and configure the SSM agent to send data to AWS CloudWatch.
Find below the steps to download, install and configure SSM agents to send custom metrics to AWS Cloudwatch.
Log in to your instance by using Remote Desktop.
Download the latest version of SSM Agent to your instance. You have two options for downloading:
1. PowerShell:
Run the following PowerShell command. This command lets you download SSM Agent without adjusting Internet Explorer (IE) Enhanced Security settings.
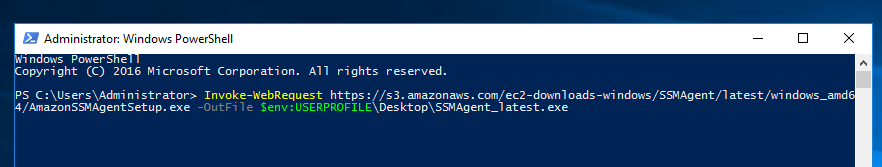
Invoke-WebRequest https://s3.amazonaws.com/ec2-downloads-windows/SSMAgent/latest/windows_amd64/AmazonSSMAgentSetup.exe -OutFile $env:USERPROFILE\\Desktop\\SSMAgent_latest.exe
2. Download link:
Download the latest version of SSM Agent to your instance by using the following link. If you want, update this URL with a region-specific URL.
Run the downloaded AmazonSSMAgentSetup.exe file to install SSM Agent.
Start or restart SSM Agent by sending the following command in PowerShell:
Restart-Service AmazonSSMAgent
Update SSM agent on instance.
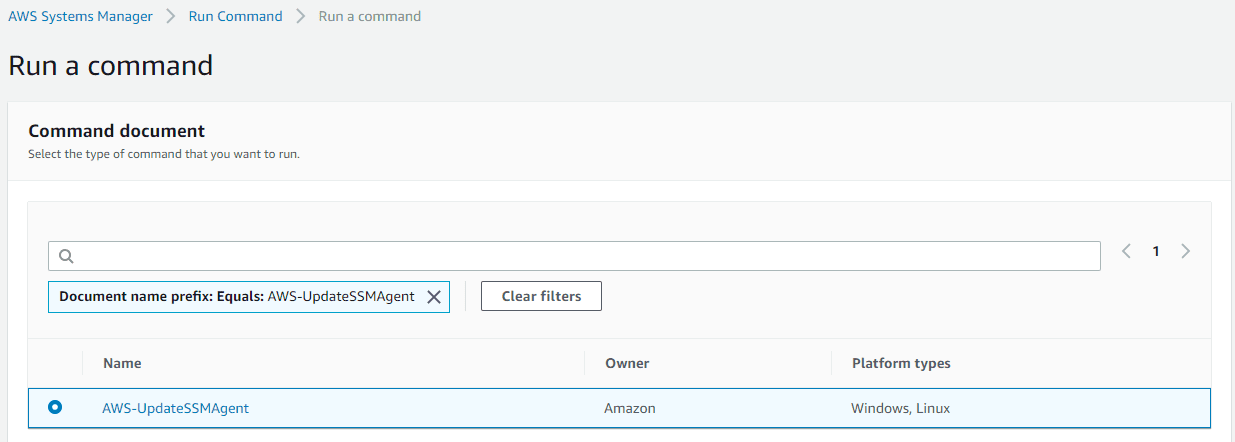
Go to Systems Manager:
In Run a Command selects AWS-UpdateSSMAgent.
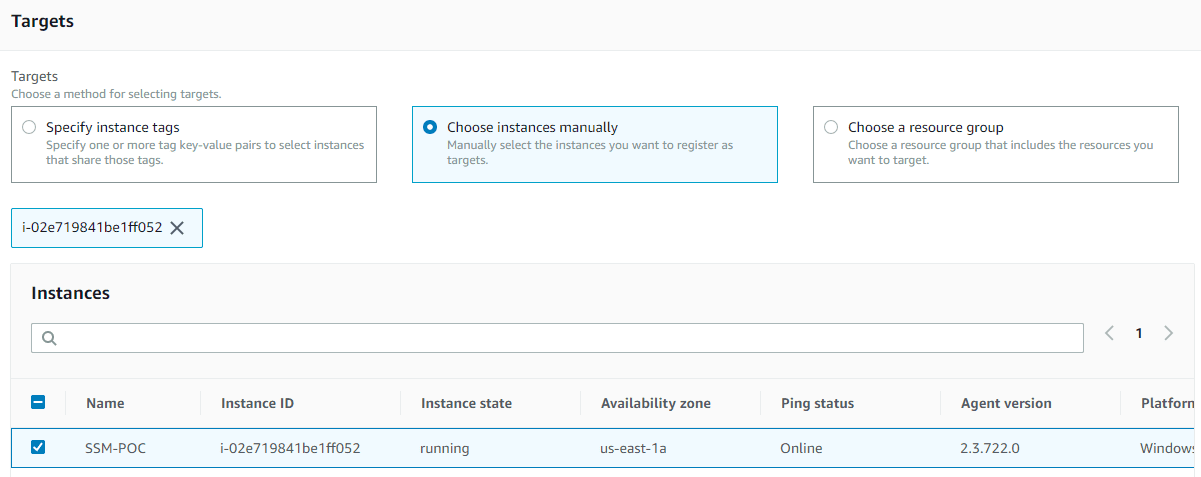
In the Targets section, We can select how many servers we want.
Check platform within AWS Command Line Interface command tab
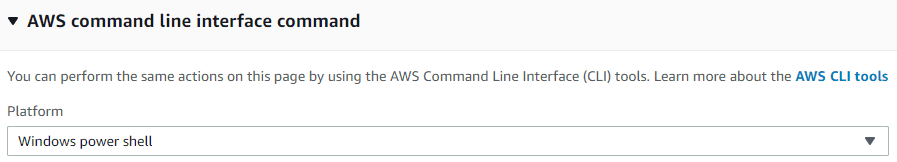
Click on Run Command.
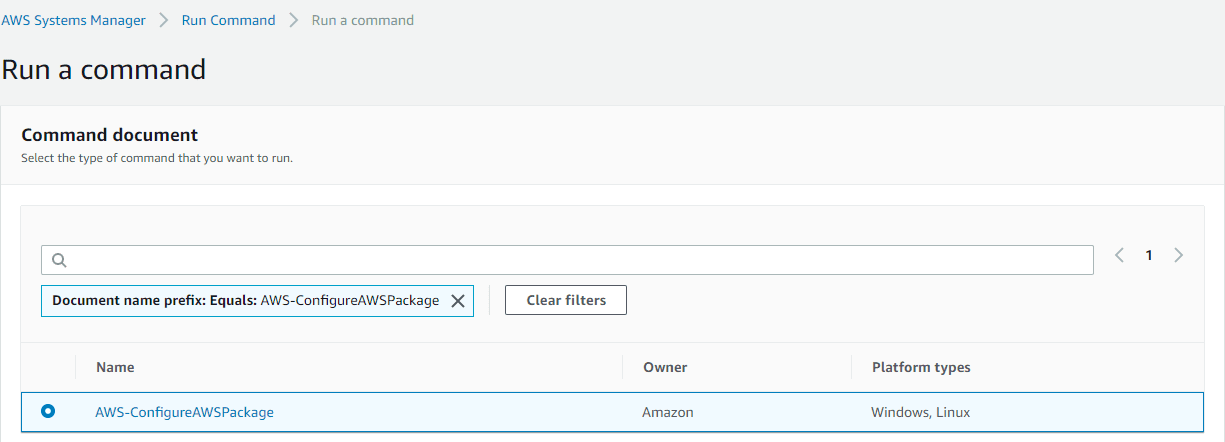
In the Command document list, choose AWS-ConfigureAWSPackage.
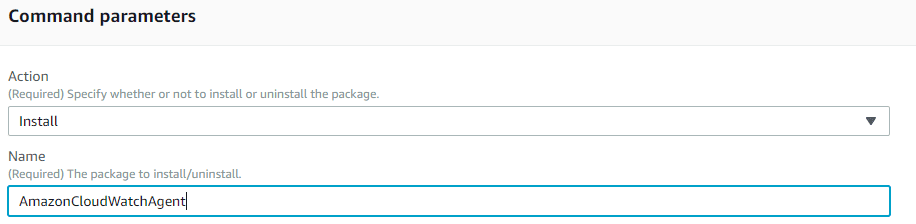
In the Action list, choose Install.
In the Name field, type AmazonCloudWatchAgent.
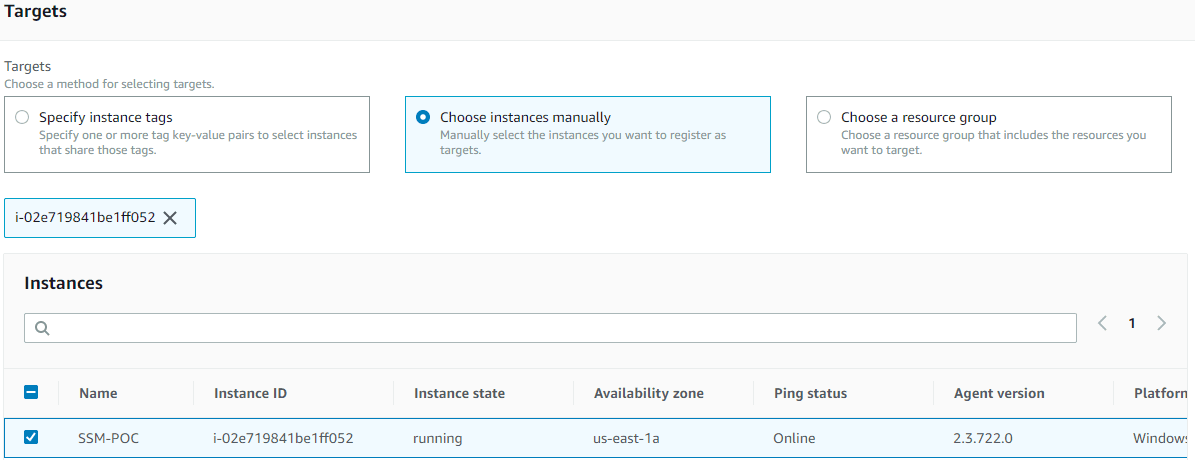
In the Targets area, choose the instance on which to install the CloudWatch agent.
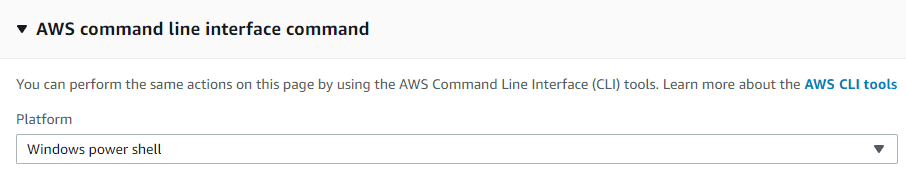
Check platform within the AWS Command Line Interface command tab and Choose Run at last.
Go to AWS Systems Manager => Parameter Store
Create a Parameter name like this for Windows (AmazonCloudWatch-Windows).
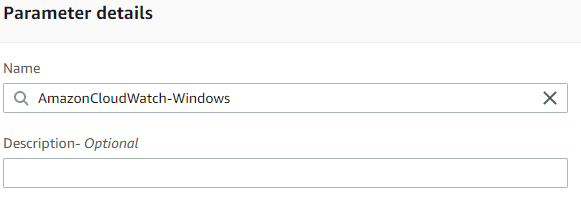
Click on Create parameter,
Name field enters AmazonCloudWatch-Windows.
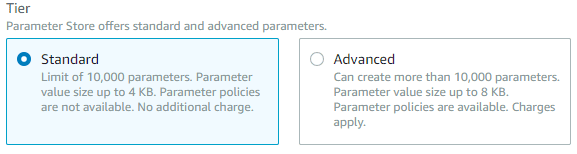
Select Tier Standard
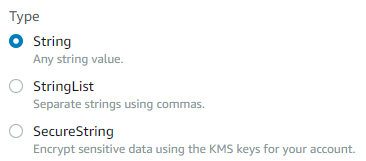
Select Type String.
In Value Box we need to paste the code for our requirements.
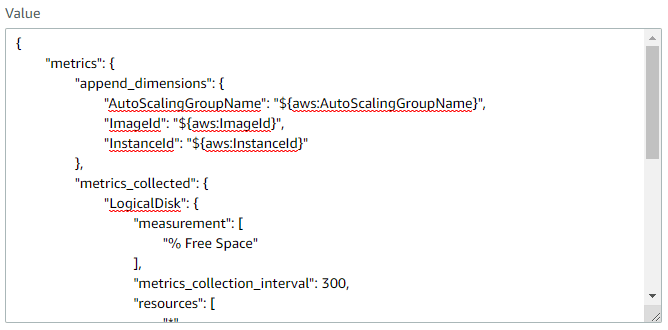
For Windows:
{
“metrics”: {
“append_dimensions”: {
“AutoScalingGroupName”: “${aws:AutoScalingGroupName}”,
“ImageId”: “${aws:ImageId}”,
“InstanceId”: “${aws:InstanceId}”
},
“metrics_collected”: {
“LogicalDisk”: {
“measurement”: [
“% Free Space”
],
“metrics_collection_interval”: 300,
“resources”: [
“*”
]
},
“Memory”: {
“measurement”: [
“% Committed Bytes In Use”
],
“metrics_collection_interval”: 300
},
“statsd\”: {
“metrics_aggregation_interval”: 300,
“metrics_collection_interval”: 300,
“service_address”: “:8125”
}
}
}
}
The above code is used to get Auto scaling metrics, Logical disk usage, and Memory usage.
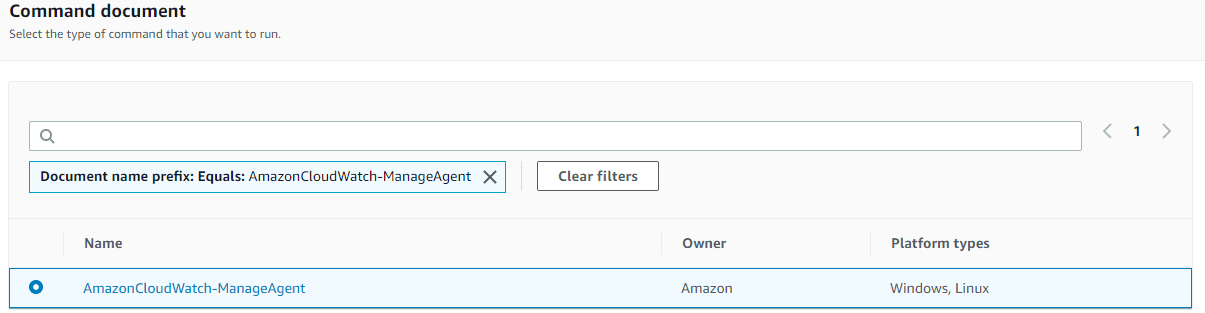
In the Command document list, choose AmazonCloudWatch-ManageAgent.
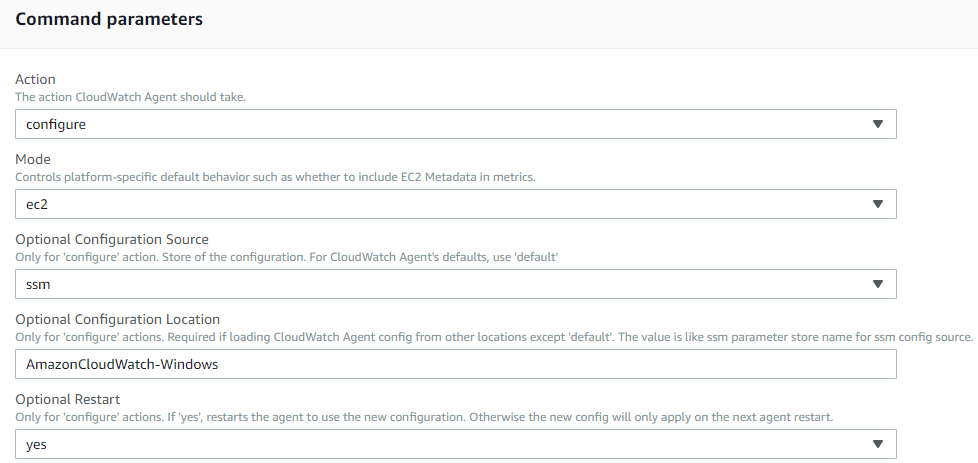
In Command parameters
In the Action list, choose to configure.
In the Optional Configuration Source list, choose ssm.
In the Optional Configuration Location box, type the name of the agent configuration file you created and saved to Systems Manager Parameter Store, for example- Optional Configuration Location: AmazonCloudWatch-Windows.
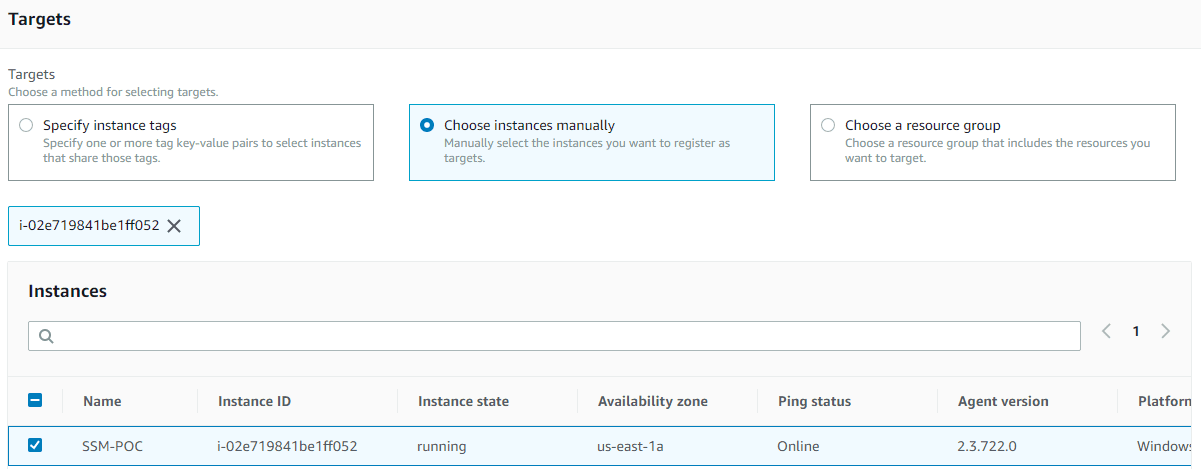
In the Targets section, please select how many instances we want.
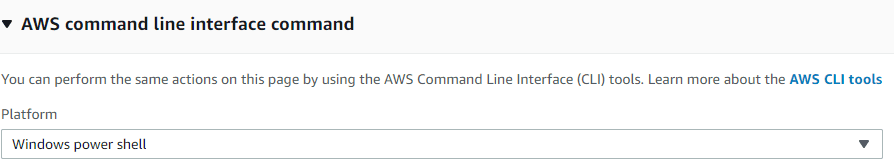
Check the platform within the AWS Command Line Interface command tab and Choose Run.
This will start sending Cloudwatch metrics such as Memory utilization, Disk usage, and autoscaling group metrics, and you can see them in Cloudwatch metrics.